by: VectorVest Inc.
There’s no shortage of speculation about Valeant Pharmaceuticals (VRX), but what happens when you strip away the opinions & predictions?
You get the truth. And the truth can lead to big profits (or protect your capital so you can live to trade another day).
VectorVest’s Stock Analyzer tool removes the emotion by letting math-based indicators take over the tedious task of interpreting what the numbers have to say.
So, let’s take a look at what’s really going on with VRX, starting with VALUE.
While VRX has traded as high as $263.81 (Split-adjusted, August 6, 2015), its current Value, based on a combination of interest, inflation and earnings factors is quite close to that high at $22.11.
Valeant was trading at an extreme premium at that time.
The August 22, 2016 close of $31.27 brings the price out of the stratosphere, but VRX’s stock is still overvalued.
Does that mean investors should stay away?
Not necessarily.
Remember, $22.11 is what VRX is worth at this moment. Clearly, the market is willing to pay more. Stocks with high growth rates or other promising aspects, like high safety or great dividends, often trade for a premium price.
So, what’s needed next is an analysis of Valeant’s long-term outlook. VectorVest’s RELATIVE VALUE (RV) indicator takes care of that by measuring the price appreciation potential over the next 1-3 years.
(Careful not to dismiss this indicator if you are a short-term trader – high RV stocks make excellent short-term trades too!)
Relative Value for Valeant Pharmaceuticals is 0.72 on the VectorVest indicator scale of 0.00 – 2.00 (anything above 1.00 is favorable), that means the prospects for VRX trading higher over the next 1-3 years are poor. It also means that VRX’s numbers point to a lower ROI than you could expect from investing the same amount in a AAA corporate bond.
Not what most investors want to hear, but that’s not the end of VRX’s story.
You also need to know how much risk a potential investment in VRX carries.
That’s the job of Relative Safety (RS). The RS indicator is like a financial report card for a company. VRX has an RS rating of 0.88. (Remember, above 1.00 is favorable on the VectorVest scale!)
That’s not the worst score…but it’s not the best.
Safety is considered fair for VRX.
The fundamentals show that VRX is on somewhat shake ground, making it a speculative investment, but there’s still a bit more that the VectorVest analysis has in store for you.
The ultimate trump card in our analysis is TIMING.
If you’ve ever bought a GREAT stock at the WRONG time, you’ve felt the pain it can cause first hand. In contrast, even the lousiest stock (umm… Enron, anyone?) can make an investor rich if they know when the time is right to buy and sell.
VectorVest believes that the time to buy a stock is when it’s already doing what you want it to do – that means rising in price -preferably in a rising industry and a rising market!
Talk about stacking the odds in your favor!
VectorVest’s Relative Timing indicator analyzes the price trend AND momentum for you. It analyzes all the dynamics of price, not just over 1-time frame, but four to let you know whether the stock is in an uptrend or downtrend and how fast it’s moving.
VRX has an RT of 1.58 – Price is in an uptrend for the short-term and momentum is excellent.
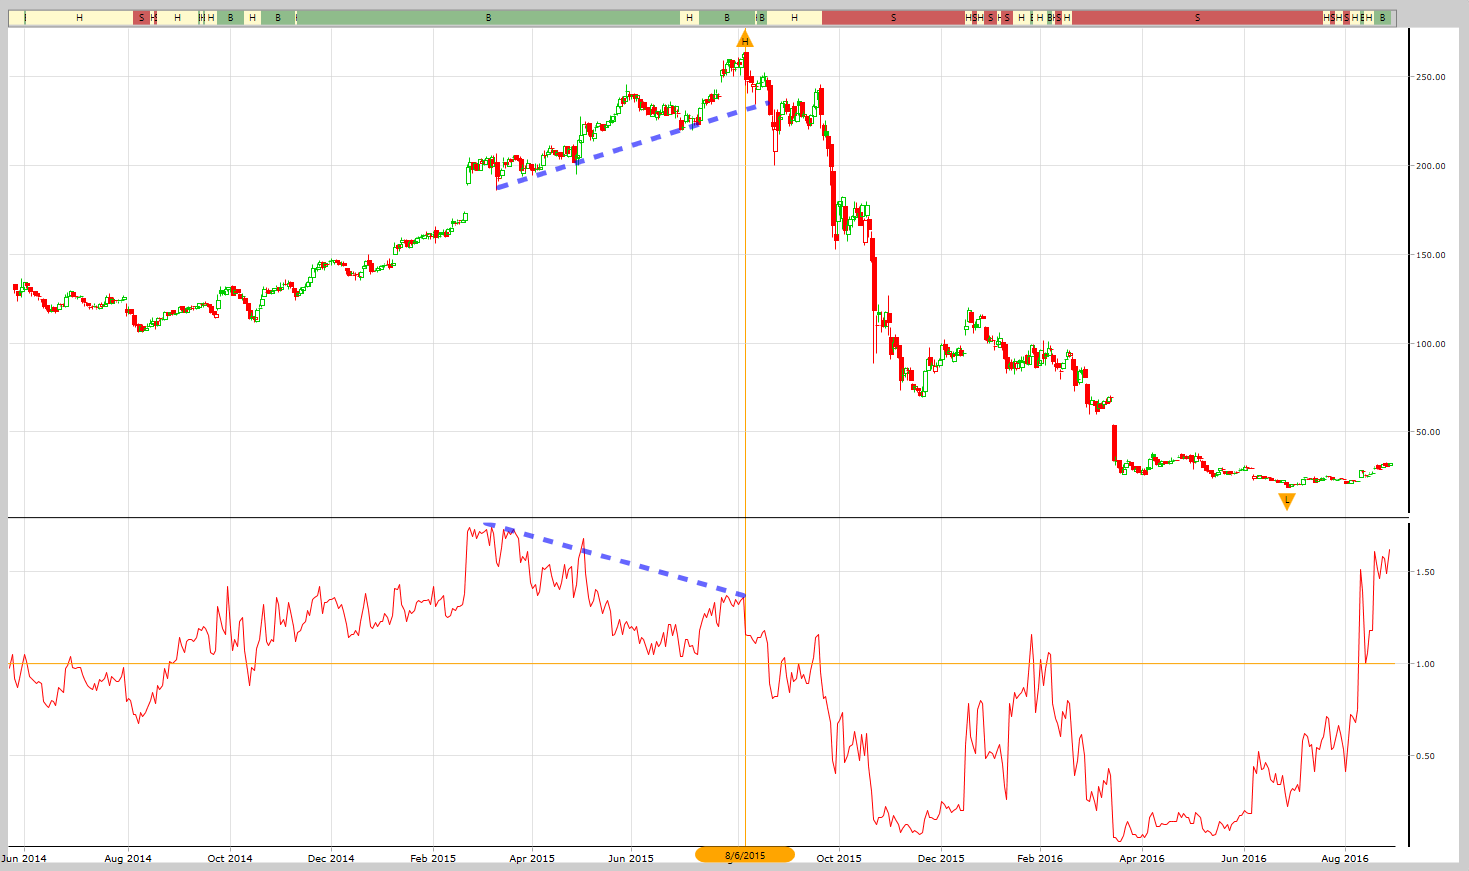
VectorVest’s RT Timing indicator often points out major reversals before they happen via bullish and bearish divergences. Looking at VRX’s chart, you’ll see that even though the stock hit a new 52-week high on August 6, 2015, Relative Timing was showing a bearish divergence with a series of much lower lows.
VectorVest sums up both the fundamental (value and safety) and technical (price trend) indicators on Valeant Pharmaceuticals using a single indicator – VST (that stands for Value, Safety & Timing). VRX’s VST is 1.17 which is considered “good.”
(Pssst…This master indicator is genius when it comes to ranking dozens, or even thousands, of stocks from best to worst. For example, VectorVest’s top ranked stock in the Durg/Ethical is Endo Pharmaceutical/ENDP with a Relative Value of 1.38, relative safety of 0.78, relative timing of 1.44 and a combined VST of 1.24.)
At the end of the day though, you really just want to know whether to buy, sell or hold, right?
Well, according to VectorVest’s rule-driven rating system, Valeant Pharmaceuticals is currently a Buy, largely due to its strong short-term price trend and adequate, though not impressive, fundamentals.
In closing, you should never buy a stock without a knowing when to sell. VectorVest calculates a stop-loss price for every stock, every day, and the stop for VRX is currently set at $25.22.
Is VRX right for your portfolio? Only you can make that call, but now you have the un-biased information to help you make the most profitable decision.
Get all this information and more in VectorVest’s Instant Stock Analysis Reports – Visit www.vectorvest.be/analyze to analyze ANY stock FREE.
VectorVest has been providing the highest quality investment research to investors for 28 years. The company’s comprehensive approach to investing combines the insight of fundamental valuation with the power of technical analysis in an easy-to-use stock analysis software package designed for all types of investors. VectorVest provides a Buy, Sell or Hold rating for over 23,000 stocks each day based on its proprietary Value, Safety and Timing system. The demand for its indicators and market timing information has prompted worldwide expansion. Today VectorVest analyzes markets in the U.S., Canada, Europe, U.K., Singapore, Australia, Hong Kong and South Africa.


